


Overview
All data is plotted as a series, and each series consists of a related group of data points. Each data point consists of an X value that may determine where a data point is plotted, and correlates to the DataPoint.XValue property. Each data point also has one or more Y values; these Y values are comprised of data points that correlate to the DataPoint.YValues array property. All chart types use one Y value, except for the bubble, candlestick, range, and stock chart types. These charts require more than one Y value, since one data point consists of multiple values. For example, to plot one stock chart column, four values are required including high, low, open, and close values.
When you add data points to a series, the X value does not have to be specified. This is the case because the X value data, by default, is automatically plotted along the x-axis (i.e. the X value for all data points in a series can be zero). Also, data points can be plotted using their index instead of their X values. This is done by setting the XValueIndexed property of the data point's series to True. In both cases, data is plotted sequentially starting from zero.
How to add Data to a Chart
You can use data-binding to add data to a chart, however, there are other ways to add data that do not involve data-binding. With data-binding, you do not have to iterate through your data because this is done automatically by the binding mechanism, and the X value, Y value(s), and other chart properties are set during this automatic looping process.
 Note Note |
|---|
| The type of data-binding used determines how often the data is traversed, as well as the chart properties set. |
You must first determine whether or not to use data-binding. You can determine this by using three prevalent factors.
You should use data-binding if:
- Your datasource is in a format suitable for binding.
- Your datasource does not need to be manipulated before it is displayed.
Your datasource can set the Chart properties as required.
Using Objects as a Datasource
Any IEnumerable object can be used as a datasource, including a:
-
DataView.
-
DataReader (SQL, OleDB).
-
DataSet (DataSource databinding ONLY).
-
DataTable (DataSource databinding ONLY).
-
DataRowColection.
-
Array.
-
List.
-
SqlCommand / OleDbCommand (DataSource databinding ONLY).
-
SqlDataAdapter / OleDbDataAdapter (DataSource databinding ONLY).
-
SqlDataReader / OleDbDataReader.
-
Any other IEnumerable objects.
If your datasource must be traversed and modified for some reason, then consider adding your data to the chart from within your traversal code loop. This will increase the overall performance of your chart. On the other hand, if you continue to use databinding in this case, then your datasource must be traversed again at least one more time before it can be displayed. In some cases, it is not unusual for databinding methods to traverse a datasource once per series, and in extreme cases, some methods may require that the datasource be traversed once per method call.
| Note |
|---|
| Those chart properties that can be databound depend on the databinding method used to bind them. |
The following Chart properties can be databound.
-
XValue.
-
YValue(s).
-
Extended Chart properties, which include the following:
-
Tooltip.
-
Label.
-
AxisLabel.
-
LegendText.
-
LegendTooltip.
-
All custom attributes, using the attribute name.
-
By now, you should have a good idea of whether or not you will be using databinding to add data to your charts. If you have decided to use databinding to add data to your charts from a datasource, then we recommend that you read the topic on Data Binding for information on how to do this. If instead you have chosen to add data to your charts using a non-binding method, then you may continue herein.
Adding Data Without The Use of Databinding
There are several different ways to manually add data points to a series. You can add data points to a series:
-
At design-time, using the Points Collection, and use Design View.
Advantages: You can inspect your data at design-time, and use the Properties window to set attributes. Disadvantages: All of your data point values are hard-coded in your application. -
At run-time, using the DataPointCollection methods such as Add, AddY, AddXY, Insert.
Advantages: Allows for addition of data from any kind of datasource, including custom user functions. Disadvantages: Data points are not visible at design-time.
Adding Data at Design-Time
This sample code can be entered manually using the Properties Dialog (Design-Time) and adding points to the Point Collection of each series. For chart types that accept multiple Y Values, the YValues are comma-separated.
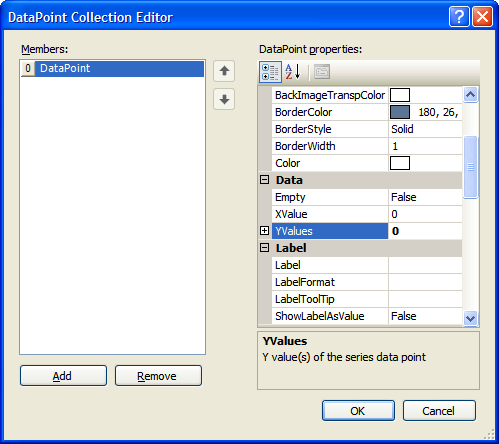
Figure 1: The DataPoint Collection Editor.
Adding Data at Run-Time
When the chart Control has been loaded, and the Load event has fired, you can access the Points collection property of the Series object to add your data points. This collection supports the IList interface, which implements functions that can be used to manipulate DataPoint objects such as Add, Insert, and Remove. There are also two helper functions called AddY and AddXY, both of which add one data point using a more simple syntax than that provided by the IList interface.
| Note |
|---|
| Data can also be added to your charts at run-time by using data-binding. |
Example
This example demonstrates how to add a couple of data points to the control at run-time.
| Visual Basic |  Copy Code Copy Code |
|---|---|
| |
| C# | Copy Code |
|---|---|
| |
Example
This example demonstrates how to add more than one Y value per data point using a comma separated list. This example uses a data point for a bubble chart with X=2, Y=8, and Diameter=20.
| Visual Basic | Copy Code |
|---|---|
| |
| C# | Copy Code |
|---|---|
| |
Aligning Data Using Axis Labels
Two issues arise when multiple indexed series are plotted, and the X values are being bound to string values:
- First, it is uncertain that data points from different series, with the same X value string, will be plotted at the same index (i.e. position) along the X axis.
- Second, only the axis label for the first series' point will be displayed, even though points from other series with the same index have axis labels too.
Example
This example demonstrates how to AlignDataPointsByAxisLabels. Two series are plotted each containing data points. The first series' points have the following labels: "Point 1 - Series 1" and "Point 2". The second series has the axis labels: "Point 1 - Series 2" and "Point 2". In the left-hand image, the first points in the two series are plotted together because they have an index of 0.
The AlignDataPointsByAxisLabels method takes care of this by aligning data points along the X axis using their axis labels. Data points with the same index, but with different axis labels, are plotted at different locations along the X axis. In effect, calling this method allows for the X value, which is a string, to determine where data points are going to be plotted.
Several conditions must be met when calling AlignDataPointsByAxisLabels, otherwise an exception will be thrown:
- The series must be indexed (X values of data points must be zero, or XValueIndexed must be true).
- All AxisLabel properties are non-empty, and are unique for each series.
However, if we call the AlignDataPointsByAxisLabel method the first points in the two series are separated and plotted at different locations along the X axis since they have different axis labels (see Figure 2 below). The second points are not separated since they both have an axis label of "Point 2". We assume a "DundasBlue" template has been added for appearance purposes.
| Visual Basic | Copy Code |
|---|---|
| |
| C# | Copy Code |
|---|---|
| |
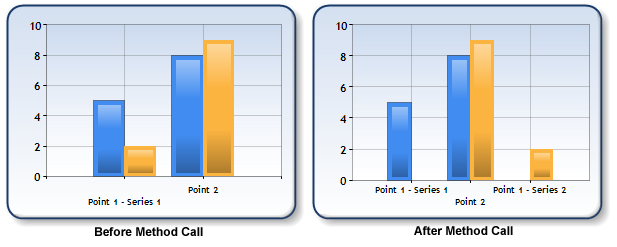 |
| Figure 2: Data points are aligned using their axis values. |
By default, points are plotted in the order in which they are stored in their series. To specify a sort order, use a definition that has a sortingOrder parameter. By default, all series within a chart are aligned. To specify that only specific series be aligned, use a method definition that takes a Series parameter.