


Overview
Strip lines, or strips, are horizontal or vertical lines that are used to highlight specific sections of a Chart Area. Strip lines can be displayed using the Axis object's Interlaced property, or the StripLines collection property. When a chart is drawn on screen, interlaced strip lines are always drawn first, followed by the strip lines specified using the StripLines collection property. Strip lines may be added at design-time using the Axis Collection Editor, or at run-time using programming code.
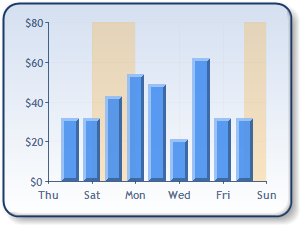
Figure 1: Adding strip lines to display weekends.
Using the Interlaced Property
If the Interlaced property is set to true, then strip lines are drawn on every other grid line interval for the relevant axis. If grid lines are not used for the axis, then the axis's tick marks, or labels, are used to determine the interlaced strip lines interval. The color of the interlaced strip lines is determined by the InterlacedColor property. Interlaced strip lines cannot have their border color set; to specify a border color, use the StripLines collection property to display the strips. The big difference between using this Interlaced property and the StripLines property, is that the interval for the interlaced strip lines is set automatically. Further, StripLine objects, which are stored in the StripLines collection property, offer more functionality than strips that are displayed using the Interlaced property.
Using the StripLines Collection Property
The StripLines property is a StripLinesCollection object that stores StripLine objects. A single StripLine object can either be drawn once, or repeatedly, for a given interval. This is controlled by the Interval property. When a value of zero is assigned to this property, it will result in one strip being drawn; a non-zero value will result in the strip being drawn repeatedly for the given interval. The location of where a strip line is drawn is also affected by the IntervalOffset and IntervalOffsetType properties. For a pictorial representation of interval-related properties see the topic on Grid Lines and Tick Marks which applies to strip lines as well.
When multiple strip lines are defined for an axis, there is a possibility of overlap. The z-order of StripLine objects is determined by their order of occurrence in the StripLinesCollection object. The z-order follows this convention, the first occurrence is drawn first, the second occurrence is drawn second, and so on. The z-order of strip lines can be changed at design-time by using the arrow buttons in the StripLineCollection Editor. Each StripLine object has a Tooltip property.
Example
This example demonstrates how to define strip lines to highlight values on the chart that are between $20 and $60. We assume that the Series data was added at design-time. Further, we assume that the DundasBlue template has been applied to the original chart for appearance purposes.
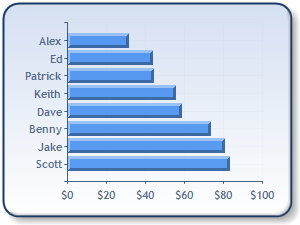
Figure 1: Chart without strip lines.
| Visual Basic |  Copy Code Copy Code |
|---|---|
| |
| C# | Copy Code |
|---|---|
| |
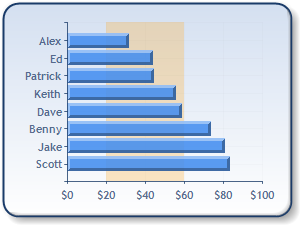
Figure 2: Strip lines added.
 See Also
How To
Axis Types