


Overview
Bollinger Bands are indicators that are plotted at standard deviation levels above, and below a simple moving average. Since standard deviation is a measure of volatility, a large standard deviation indicates a volatile market, and a smaller standard deviation indicates a calmer market. Bollinger Bands are a good way to compare volatility against relative price levels, over a period of time.
 Note Note |
|---|
| We recommend that you read Using Financial Formulas before proceeding any further. Using Financial Formulas provides a detailed explanation on how to use formulas, and also explains the various options available to you when applying a formula. |
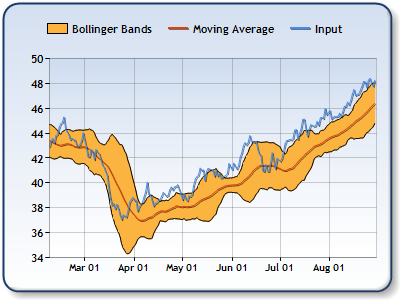 |
| Figure 1: A price indicator, 20-day moving average, and Bollinger Bands. |
Applying a Bollinger Bands Formula
All formulas are calculated using the FormulaFinancial method, which accepts the following arguments: a formula name; input value(s); output value(s), and parameter(s) that are specific to the type of formula being applied.
Before applying the FormulaFinancial method, make sure that all data points have their XValue property set, and that their series' XValueIndexed property is set to false.
The following table lists the parameters used in the FormulaFinancial method to calculate an Bollinger Bands, and also supplies a description of what these parameters mean:
| Parameter |
Value/Description |
Example |
| Formula Name: |
BollingerBands
|
FormulaFinancial(FinancialFormula.BollingerBands,"20,2","Series1:Y2","Series2:Y,Series2:Y2") |
| Input Value: | The price for which the Bollinger Bands has to be calculated. The price can be one of the following: Hi, Low, Open or Close price. The most used price is Close (by default the fourth Y value for a stock chart). |
FormulaFinancial(FinancialFormula.BollingerBands,"20,2","Series1:Y2","Series2:Y,Series2:Y2") |
| Output Values: |
Value #1: The upper Bollinger Band. |
FormulaFinancial(FinancialFormula.BollingerBands,"20,2","Series1:Y2"," Series2:Y,Series2:Y2") |
|
Parameters: |
Parameter #1: The Period property, used to determine a time period which is used in Bollinger Bands. |
FormulaFinancial(FinancialFormula.BollingerBands,"20,2","Series1:Y2","Series2:Y,Series2:Y2") |
The Period is the time period used when displaying Bollinger Bands.
The Range Chart is the most convenient chart type used for displaying Bollinger Bands. Line charts can be used as well, as long as two series are used to display the Bollinger Bands.
Financial interpretation: Bollinger Bands can be used with other indicators to generate signals for buying and selling. They can also be used to find a period with overbought and oversold levels. The narrowing of the Bollinger Bands increases the probability of a sharp breakout in prices. The longer prices remain within the narrow bands, the more likely a price breakout will occur.
Calculation: The first step in calculating the Bollinger Bands is to find the simple moving average.

The upper and lower Bollinger Bands are calculated by determining a simple moving average, and then adding/subtracting a specified number of standard deviations from the simple moving average to calculate the upper and lower bands.

In the above formulas, D represents the number of standard deviations applied to the Bollinger Bands indicator.
Example
This example demonstrates how to calculate a 20 day Bollinger Band. To draw the moving average in the middle of the bands, the formula for the simple moving average has to be used.
| Visual Basic |  Copy Code Copy Code |
|---|---|
| |
| C# | Copy Code |
|---|---|
| |