


Overview
Envelopes are plotted above and below a moving average using a specified percentage as the shift. The envelopes indicator is used to create signals for buying and selling, and the percentage to be used for calculating the envelopes is specified by the user. This percentage should depend on the volatility of the market (the higher the market volatility, the higher the percentage should be).
 Note Note |
|---|
| We recommend that you read Using Financial Formulas before proceeding any further. Using Financial Formulas provides a detailed explanation on how to use formulas, and also explains the various options available to you when applying a formula. |
 |
|
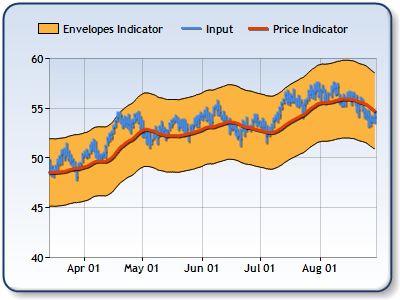
Figure 1: This chart shows a price indicator, a 20 days Moving Average and an Envelopes indicator. |
Applying an Envelopes Formula
All formulas are calculated using the FormulaFinancial method, which accepts the following arguments: a formula name; input value(s); output value(s), and parameter(s) that are specific to the type of formula being applied.
Before applying the FormulaFinancial method, make sure that all data points have their XValue property set, and that their series' XValueIndexed property is set to false.
The following table indicates what sort of FormulaFinancial method arguments to use when calculating a Envelopes, and also supplies a description of what these parameters mean:
| Parameter |
Value/Description |
Example |
| Formula Name: |
Envelopes
|
FormulaFinancial(FinancialFormula.Envelopes,"20,7","Series1:Y2","Series2:Y,Series2:Y2") |
| Input Value: | The value for which the Envelopes have to be calculated. It could be a price such as: Hi, Low, Open or Close values. The most used price is closed. |
FormulaFinancial(FinancialFormula.Envelopes,"20,7","Series1:Y2","Series2:Y,Series2:Y2") |
| Output Values: |
Value #1: The upper Envelope. |
FormulaFinancial(FinancialFormula.Envelopes,"20,7","Series1:Y2"," Series2:Y,Series2:Y2") |
|
Parameters: |
Value #1: Period parameter, which is a time period used to calculate the Moving Average. |
FormulaFinancial(FinancialFormula.Envelopes,"20,7","Series1:Y2","Series2:Y,Series2:Y2") |
The Range Chart type is the most convenient chart type for envelopes. A line chart could also be used, in which case two series would have to be used.
Financial Interpretation: The Envelopes indicator can be used with other indicators to generate signals for buying and selling. The percentage which is used for calculating the envelopes is specified by the user and depends on the volatility of the market. If the market is more volatile the percentage should be higher.
A price is in an up-trend when it stays above the moving average and is in a down-trend when it stays below the moving average.
Calculation: The first step is to find the Moving Average, and the second step is to shift the moving average up and down a specified percentage.
Example
This example demonstrates how to calculate 20 days Envelopes. To draw the moving average in the middle of the bands the formula for a simple moving average has to be used.
| Visual Basic |  Copy Code Copy Code |
|---|---|
| |
| C# | Copy Code |
|---|---|
| |