


Overview
There are two types of grid lines and tick marks, those that are considered to be major, and those that are considered to be minor. By default, major grid lines and tick marks are enabled, and minor tick marks and grid lines are not. To display minor grid lines, or tick marks, you must set their Enabled property to True.
Accessing The Grid Lines And Tick Marks Properties
Follow these steps to set the properties for Grid Lines or Tick Marks:
- Click on the web part dropdown menu, and choose Advanced Properties.
- In the Advanced Properties dialog, click on Chart Areas found in the navigation pane to the left.
- In Chart Areas, choose an axis from the dropdown list.
- Go to the Grid Lines and Tick Marks section, and choose your settings for these items.
- Once you are done, click on the Finish button to complete the process.
 |
|
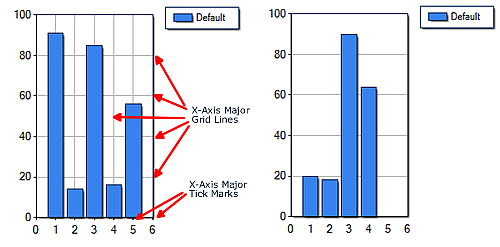
Figure 1: A chart with grid lines and tick marks (shown left), and a chart without grid lines and tick marks (shown right). |
It is worthy to note that in Figure 1 above we demonstrate a chart with grid lines and tick marks being used on its x-axis. These could have easily been shown using the y-axis, which would have affected the vertical grid lines and tick marks instead. You have the option of including, or excluding grid lines and tick marks on every axis including the x-axis, the y-axis, the secondary x-axis, and the secondary y-axis.
For more information on chart elements, refer to the topic on Chart Elements.
Parent Axis Object
The parent Axis object of tick marks, and grid lines has an Interval, IntervalOffset, IntervalType, and IntervalOffsetType property. If a major grid line or tick mark has its Interval property set to the value NotSet, then by default, the parent Axis object's Interval property value is used. In any event, the property settings of the parent Axis object do not affect the interval-related properties of minor grid lines, and tick marks of an axis.
To set the IntervalType, and IntervalOffsetType properties to the value NotSet, use the value DateTimeIntervalType.NotSet.
When Axis.Interval is set to Auto, the IntervalAutoMode property determines how many intervals should be calculated. If your chart is being resized or redrawn often, you can set the IntervalAutoMode property to VariableCount, in which case the chart will dynamically calculate axis intervals. This is especially useful in situations where the chart intervals are displayed differently depending on the data used.
 Note Note |
|---|
| The Axis object cannot have its IntervalType, or IntervalOffsetType property set to the value NotSet. |
To set the IntervalType, and IntervalOffsetType properties to Auto, use a value of DateTimeIntervalType.Auto.
To set the Interval and IntervalOffset properties to Auto, use a value of zero. To set these properties to a value of NotSet, use the value Double.NaN, but remember that this is not applicable to the Axis object.
| Note |
|---|
| Grid lines and tick marks for custom axis labels, implemented using the CustomLabels property, are not affected by the interval-related properties. |
If the interval type of a grid line or tick mark object is Auto, then the Interval, and IntervalType for grid lines and tick marks will be determined automatically using the data points that have already been plotted.
Properties Of Grid Lines And Tick Marks
The following table summarizes the properties of grid lines and tick marks:
|
Grid Line and Tick Mark Properties | |
|
Enabled |
Grid lines and tick marks can be disabled on a per axis basis. Defaults to true for major grid lines and tick marks. Simply enabling Grid lines and Tick Marks will result in these objects automatically spaced along the axis unless the Interval property has been set. |
| Interval | Sets the size of the Grid Line or Tick Mark interval. |
| IntervalOffsetType | Sets the type of offset to use for the interval. |
| IntervalOffset | Sets the offset value for the interval. |
| IntervalType | Sets the type of interval used. |
|
Grid line and tick mark line attributes. | |
|
Properties used for tick marks only. The Size property determines the length of a tick mark, while the Style property determines if tick marks occur outside, inside or across the relevant axis line. | |
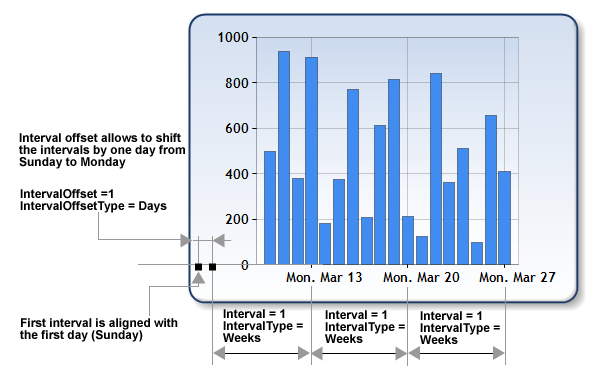
Figure 2: A pictorial representation of the interval-related properties.
Grid Lines And Tick Marks For Custom Labels
Major grid lines and major tick marks are enabled/disabled for custom axis labels using the GridTick property of the CustomLabel objects, and are displayed on a custom label by custom label basis. These major grid lines and tick marks utilize the appearance properties of the relevant Axis object's MajorTickMark and MajorGrid object properties, however, these "custom" grid lines and tick marks do not utilize the interval-related properties.
 See Also
How To
Using Axis Types