


Overview
Each data point in a series has X and Y values that determine its position in the plotting area. With some charts, the X value of points is not important, and does not have to be provided. In this case, the point positions in the plotting area are determined only by their point index (i.e. their location in the Points collection) and their Y values.
When X values are "indexed", the data point index, not a point's X value, is used to determine the position of points along the categorical (X) axis. For example in Figure 1 below, two charts are shown displaying the same data. However, the first chart uses non-indexed X values, therefore the X values of those points determine their location along the x-axis. The second chart is indexed, therefore its point indices are used to determine their position along the x-axis. In this case the X values are only used for the axis labels, and nothing more.
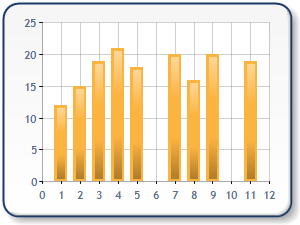
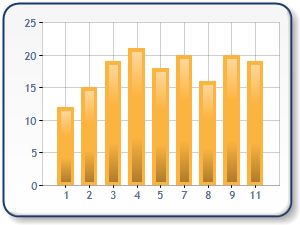
Figure 1: Two charts, one with non-indexed x-values (shown left), and the other with indexed x-values (shown right).
How to Index X Values
There are several ways to index data point X values :
- Explicitly set the X values of all data points for ALL series for a given axis to zero.
- Use the AddY / DataBindY methods instead of AddXY / DataBindXY .These functions will automatically set the X value of the data points to zero.
- Set the XValueIndexed property to true in ANY series attached to the same X axis. This will result in ALL series attached to the same axis using indexed X values. The X value or AxisLabel value of the data points are only used for labels.
Example
This example demonstrates how to display data using data point indexes. This code was used to generate the chart in Figure 1 above. The chart to the right has one extra line of code that sets the XValueIndexed property of the series to true.
| Visual Basic |  Copy Code Copy Code |
|---|---|
| |
| C# | Copy Code |
|---|---|
| |