


Overview
Axis labels are represented by the Axis.LabelStyle property. Both axes, and their associated labels, have the Interval, IntervalOffset, IntervalType, and IntervalOffsetType properties. This topic discusses setting these properties, and also provides you with tips and techniques to help you get started on creating engaging, informative, and attractive labels with a minimal effort.
Axis Label Properties
The following is a description of each of these four properties:
- Interval - Distance between the labels. This property is measured in the units specified by the IntervalType property. Changing this property does not affect the axis scale. This property can be set to zero, which will result in an automatic interval, or you can set it to an explicit value.
- IntervalType - The interval type. Possible values for this property include: Numeric, Years, Months, Weeks, Days, Hours, or Minutes. For example, if the Interval=7 and IntervalType=Days, then the distance between labels will be 7 days. Keep in mind that the beginning of the first interval will always get automatically aligned depending on the interval type. For example, if the interval type is months, the first interval will always start on the first day of the month.
- IntervalOffset - Defines the positive, or negative, offset value from the start of the first interval. The IntervalOffsetType property setting defines the unit of measurement.
- IntervalOffsetType - The interval offset type. Possible values for this property include: Numeric, Years, Months, Weeks, Days, Hours, or Minutes. For example, if the IntervalOffset is 7 and the IntervalOffsetType is Days, then the offset will be 7 days.
The properties of the axis elements (e.g. labels, etc.) are given higher priority than the Axis properties. For example, if the Axis.Interval is five, and the LabelStyle.Interval is three, then a value of three is used for the label's interval.
The following, are several important points concerning axis label intervals:
- By default, an Axis object's interval-related properties are all set to "Auto", while the interval-related properties of its associated labels are "NotSet". When an axis element, such as a LabelStyle object, has its interval or offset left unset, then its Axis parent object's value is used.
- To override this behavior you can set an interval-related property of a grid line, tick mark, or axis label to a value other than "NotSet". For example, you could use the Interval, IntervalType, IntervalOffset, and IntervalOffsetType properties of the MajorGrid, MinorGrid, MajorTickMark, MinorTickMark, or LabelStyle object properties of an axis.
- To set the IntervalType, and IntervalOffsetType properties to a value of "Not Set", use the value DateTimeIntervalType.NotSet.
 Note
NoteThe Axis object cannot have its IntervalType, and IntervalOffsetType properties set to "NotSet".
To set these properties to a value of "Auto", use the value of DateTimeIntervalType.Auto. - To set the Interval and IntervalOffset properties to "NotSet", use the value of Double.NaN (not applicable to the Axis object). To set these properties to "Auto", use a value of zero.
- It is important to note that major grid lines, major tick marks, and labels are enabled by default if the axes are also enabled. When this is the case, their interval-related properties are calculated automatically by default. If the XValueType, or YValueType properties of the first series that uses an axis is DateTime, then the interval type for grid lines, tick marks, and labels of that axis will always be calculated automatically, regardless of their IntervalType setting.
For more information on grid lines and tick marks, see the topic on Grid Lines and Tick Marks.
Code Samples
The following code samples have been included to help you get started.
Example
This example demonstrates how to set the primary X axis' minimum, maximum, interval, and interval offset values. We demonstrate how to display the axis' labels, major tick marks, and major grid lines every 20 units, with an offset of 10 units. It has been assumed that unless otherwise specified, default chart values are used.
| Visual Basic |  Copy Code Copy Code |
|---|---|
| |
| C# | Copy Code |
|---|---|
| |
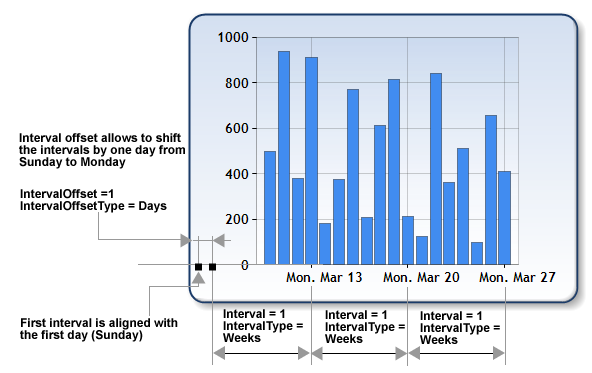
Figure 1: A chart displaying intervals, and interval offsets.
Example
This example demonstrates how to display the major grid lines, major tick marks, and labels on Mondays. We assume that a series named "Series1" has been populated with data at design-time, and that its Interval property is defined as one week. To accomplish all of this, we set the IntervalOffset for these chart elements to be 1, and the IntervalOffsetType to be in Days.
| Visual Basic | Copy Code |
|---|---|
| |
| C# | Copy Code |
|---|---|
| |