


Overview
A doughnut chart is similar to a pie chart in that it shows how individual portions of data contribute to the overall data shown with the chart. This type of chart is found under the Pie chart category of chart types.
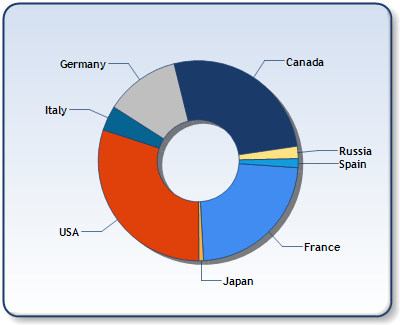
Figure 1: A Doughnut chart.
To change the size of the pie chart change the ChartArea object's Position value, InnerPlotPosition value, or both.
|
Chart Details | |
|
Number of Y values per point: |
1 |
|
Number of series: |
One only |
|
Support markers: |
No |
|
Cannot be combined with: |
Any other chart types |
|
Custom Attributes |
|
Exploded, PieLabelStyle, DoughnutRadius , |
 See Also
Chart Types
Chart Types Overview
Pie Chart