


Overview
Axes labels and grid lines make the data displayed in charts easier to read. They provide a visual guide to allow users to follow each data point to its corresponding value along the chart's axis scale. Both the X and Y primary, and secondary axes allow the use of labels, and grid lines. The properties for these elements are located in Step 3: Chart Element Properties of the Customization Wizard, however, before you can set any of these properties, you must first enable labels and grid lines by putting a check in the Show Axis Labels and Show Major Grid Lines check boxes respectively, as shown in Figure 1 below.
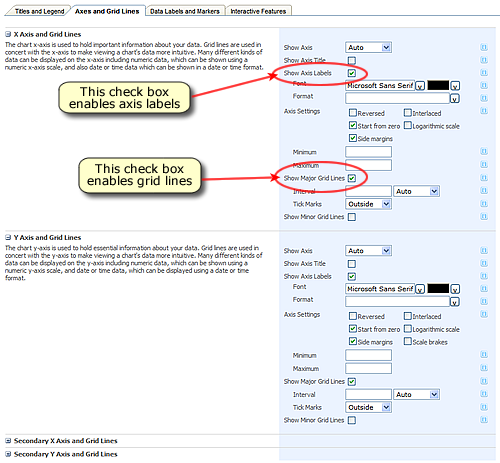 |
| Figure 1: The Axes and Grid Lines tab in step 3 of the customization wizard. |
Axis Label Properties
All axis labels, which are represented by the LabelStyle property of the Axis class, and contain the following:
- Interval: This property sets the distance between labels, and is measured in units specified by the IntervalType property. Changing the Interval property does not affect the axis scale. This property can be set to an explicit value, or it can be set to zero, which will result in an automatic interval being used.
- IntervalType: This property sets the interval type. Possible values for this property include: Numeric, Years, Months, Weeks, Days, Hours, or Minutes. For example, if the Interval=7 and IntervalType=Days, then the distance between labels will be 7 days. Keep in mind that the beginning of the first interval will always get automatically aligned depending on the interval type. For example, if the interval type is Months, the first interval will always start on the first day of the month.
- IntervalOffset: This property defines the positive, or negative offset value from the start of the first interval.
- IntervalOffsetType: This property defines the unit of measurement used for the interval offset value. Possible values for this property include: Numeric, Years, Months, Weeks, Days, Hours, or Minutes. For example, if the IntervalOffset is 7 and the IntervalOffsetType is Days, then the offset will be 7 days.
The properties of axis elements, like labels etc., are given a higher priority than the properties of the Axis. For example, if the axis Interval is set to 5, and the LabelStyle Interval is set to 3, then a value of 3 will be used for the label's interval instead of the value 5 that was set for the axis interval.
The following, are several important points concerning axis label intervals:
- By default, an Axis object's interval-related properties are all set to Auto, however, the interval-related properties of its associated labels are set to NotSet. When an axis element, such as a LabelStyle object, has its interval or its offset left unset, then its Axis parent object's value is used. To override this behavior, you can set an interval-related properties of a grid line, tick mark, or axis label to a value other than NotSet. For example, you could set a value, other than NotSet, for the Interval, IntervalType, IntervalOffset, IntervalOffsetType properties, or the MajorGrid, MinorGrid, MajorTickMark, MinorTickMark, or LabelStyle properties of the Axis class.
- To use the NotSet value for the IntervalType and IntervalOffsetType properties, use the DateTimeIntervalType.NotSet value. To set these properties to a value of Auto, use the value DateTimeIntervalType.Auto.
 Note
NoteThe Axis object cannot have its IntervalType, and IntervalOffsetType properties set to NotSet. - To set the Interval and IntervalOffset properties to NotSet, use the value of Double.NaN (not applicable to the Axis object). To set these properties to Auto, use a value of zero.
- It is important to note that major grid lines, major tick marks, and labels are enabled by default if the axes are also enabled. When this is the case, their interval-related properties are calculated automatically by default. If the XValueType, or YValueType properties of the first series that uses an axis is DateTime, then the interval type for grid lines, tick marks, and labels of that axis will always be calculated automatically, regardless of their IntervalType setting.
For more information on grid lines and tick marks, see the topic on Grid Lines and Tick Marks.
Grid Line Properties
Major and minor grid lines are represented by the MajorGrid and MinorGrid properties of the Axis class. The visual properties of grid lines are controlled by the Grid class, which contains the following public properties:
- Enabled: This boolean property enables or disables the use of grid lines.
- Interval: This property defines the interval size, which is the distance used between lines of the grid. This property can be set using Axes and Grid Lines tab in step 3 of the Customization Wizard.
- IntervalOffset: This property defines the interval offset used.
- IntervalOffsetType: This property defines the unit of measurement used for the offset value.
- IntervalType: This property defines the data type used for the interval. Using the dropdown menu found in the Axes and Grid Lines tab in step 3 of the Customization Wizard, this property can be set to Auto, Number, Years, Months, Weeks, Days, Hours, Minutes, Seconds, Milliseconds, and NotSet.
- LineColor: This property sets the color of the grid lines.
- LineStyle: This property sets the style of the grid lines.
- LineWidth: This property sets the width of the grid lines.
Follow these steps to set the Interval and IntervalType properties of grid lines in the charting web part control:
- With your SharePoint project open, choose Customize Your Chart from the web part dropdown menu.
- In the Customization Wizard go to step 3, and open the Axes and Grid Lines tab.
- In the Axes and Grid Lines tab, put a check in the Show Major Grid Lines check box to display the grid line's properties.
- Set the grid line properties as desired, and click Finish to complete your task.